The GCRO barometer (2015)
This project involved pulling together a range of data sets that reflect upon the development progress of the GCR. It utilised existing datasets from official and private sector sources as well as data generated from GCRO’s own research. A total of 38 development indicators were identified to make up the Barometer. These were carefully chosen to allow for international benchmarking.
This project generated two research outputs. The first was a web-based interactive visual tool. The second is an occasional paper that gives succinct analyses of all the 38 indicators for the period 2002 to 2012.
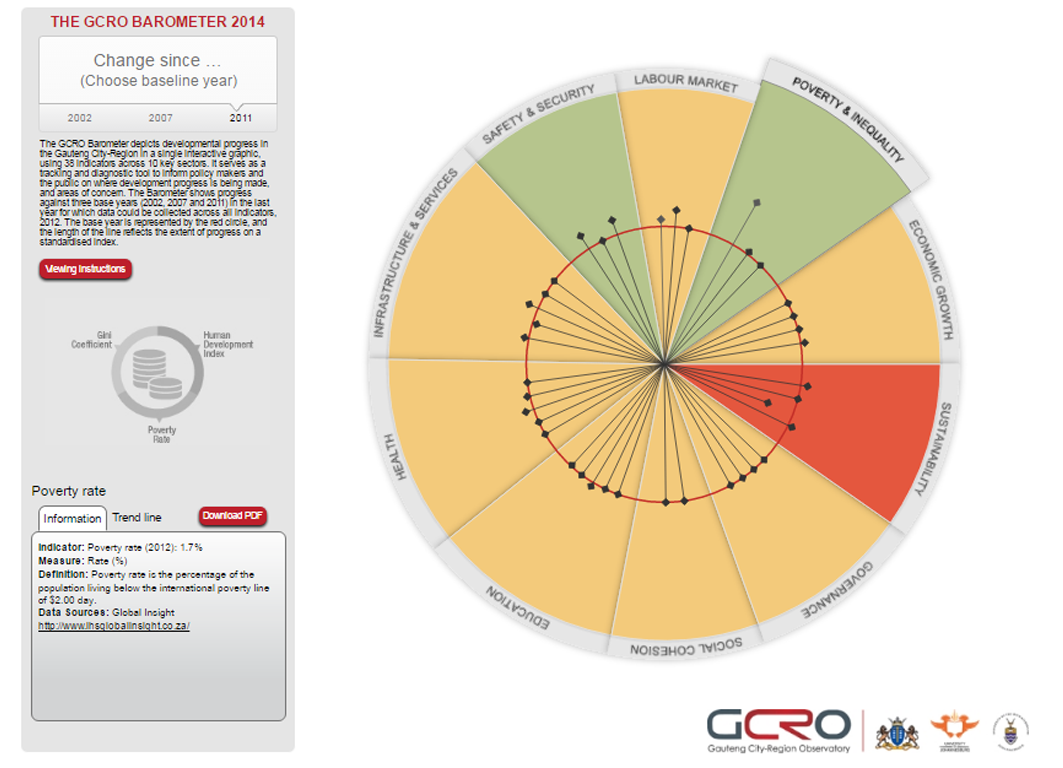
The web based interactive visual Barometer provides a composite picture of the state of the GCR in a way that assists government and policy makers to quickly and easily identify sectors that are performing and those that aren't doing so well. The visual is linked to various data sets and allows viewers to drill down into specific sectors and individual indicators. Each sector consists of number of indicators whose values determine the overall state of that sector. The analysis year was 2012 and three based years were used to compare how much progress has been made. Choosing a different base year animates the Barometer so that it shows development status in 2012 relative to the chosen base year as shown in the visual below.
The Barometer is a useful tool for monitoring government performance as well as displaying the state of the province to the public in a manner that is easy to decipher. The output identifies areas where urgent policy intervention is needed, as well as areas that require further inquiry through research.
The Barometer was published during 2014/15 financial year, and may be updated periodically in the future so that the Barometer continues to be relevant to government planning processes.
Outputs
The GCRO Barometer - web-based interactive visual tool.
Mushongera D. (2017). 'Beyond GDP in assessing development in South Africa: The Gauteng City-Region Socio-Economic Barometer'. Development Southern Africa. 34(3). 330-346.
Mushongera, D. (2015) The GCRO Barometer 2014, Occasional paper 9. Johannesburg: GCRO.
Last update 18 October 2017

