Unpaid accounts for services in the GCR: spatial patterns and underlying causes
-
- Date of publication: 12 June 2024
- Download map


Introduction
To a large extent, South African municipalities rely on utility fees for their revenues to finance their operations. However, many municipalities are experiencing a perennial problem of inadequate revenue collection, mainly due to non-payment of services (Fjeldstad, 2004). Non-payment of municipal accounts is a problem that dates back to the late apartheid era and has persisted in the post-1994 period (Chaskalson, et al., 1987). Previous research has shown that the driving factors of unpaid municipal accounts include households' inability to pay, unwillingness to pay, wrongful billing by municipalities, and dissatisfaction with the quality and quantity of municipal services (Booysens, 2001; Worku, 2018). In this month’s map, we analyse the spatial patterns of households with unpaid accounts within Gauteng municipalities. The analysis uses data from the GCRO Quality of Life (QoL) 6 survey (2020/21).
Analysis of households in arrears
The QoL 6 Survey (2020/21) administered the question “Does your household have any unpaid accounts for services like water or electricity?” Of the 13 616 QoL 6 survey respondents, 2 392 (or 18%) indicated that their households had unpaid accounts, 9 459 (or 69%) said that their households did not have arrears on their accounts for services and 1 765 (or 13%) did not know whether their households had unpaid accounts. (Many of those who said 'no' or 'don't know' might be receiving services via prepaid meters, and they are not included in this analysis which focuses specifically on households that receive accounts for services. Further information on the type of payment is in Figure 2 below). The analysis for this map of the month excludes the 1,765 who reported that they did not know whether their household had unpaid accounts, leaving a sample of 11 851 respondents. Therefore the map in Figure 1 below shows the proportion of households with unpaid accounts for services as a percentage of total households per ward that responded Yes or No to the question. To see the percentage in a ward, zoom the map by pressing the ctrl key and scrolling, then place your cursor on the cone in the ward of interest.
Figure 1: Proportions of respondents who reported that their households had unpaid accounts for services, out of those who answered Yes or No.
Across the Gauteng province, the ward-level proportions of respondents from households with unpaid accounts ranged from zero to 82%. This means that in some wards, there were no respondents who reported that their households had unpaid accounts. In others, up to 82% of the respondents indicated that their households had unpaid accounts. Except for Midvaal, all the municipalities had wards where notable proportions of respondents reported that their households had unpaid municipal accounts. In the City of Tshwane, these wards are found in the Soshanguve (A) and Mamelodi (B) areas. In the City of Johannesburg, wards where notable proportions of respondents reported that their households had unpaid accounts were concentrated in the Soweto area (F). Wards with notable proportions of respondents reporting that their households had unpaid accounts in the City of Ekurhuleni were found in four areas namely Kempton Park (C), Daveyton (D), Vosloorus (G), and Brakpan (J). In the Lesedi local municipality, wards in Heidelberg, particularly in Ratanda and Rensburg, had high proportions of respondents reporting that their households had unpaid accounts. The wards with high proportions of respondents reporting that their households had unpaid accounts in Emfuleni were mostly concentrated in Sebokeng (I) while in Mogale City they were in Kagiso (E).
Possible reasons for not having unpaid accounts
Households that said they did not have unpaid accounts for services could either be up to date with their bills, receive services through prepaid connections, or neither, for example, those not connected formally to the grid. From the QoL 6 Survey (2020/21), eight percent (8%) exclusively access electricity from unmetered sources like solar, generator, or neighbour, while three percent (3%) do not have access to any form of electricity. In the case of water, 13% have access to piped water but do not have a meter, and seven percent (7%) indicated that they access water from sources such as dams, boreholes, water tankers, and rivers.
Reasons for arrears
The respondents who reported that their households had unpaid accounts were asked to indicate the main reason for their household being in arrears. While several reasons were cited, most respondents (72%) reported that their households were in arrears because they could not afford to pay. Eleven percent stated that their accounts were in arrears because of pending disputes over billing while the rest cited other reasons ranging from not receiving bills (5%) to disputes over who should pay (1%). Figure 3 below shows the full array of the reasons why households are in arrears.
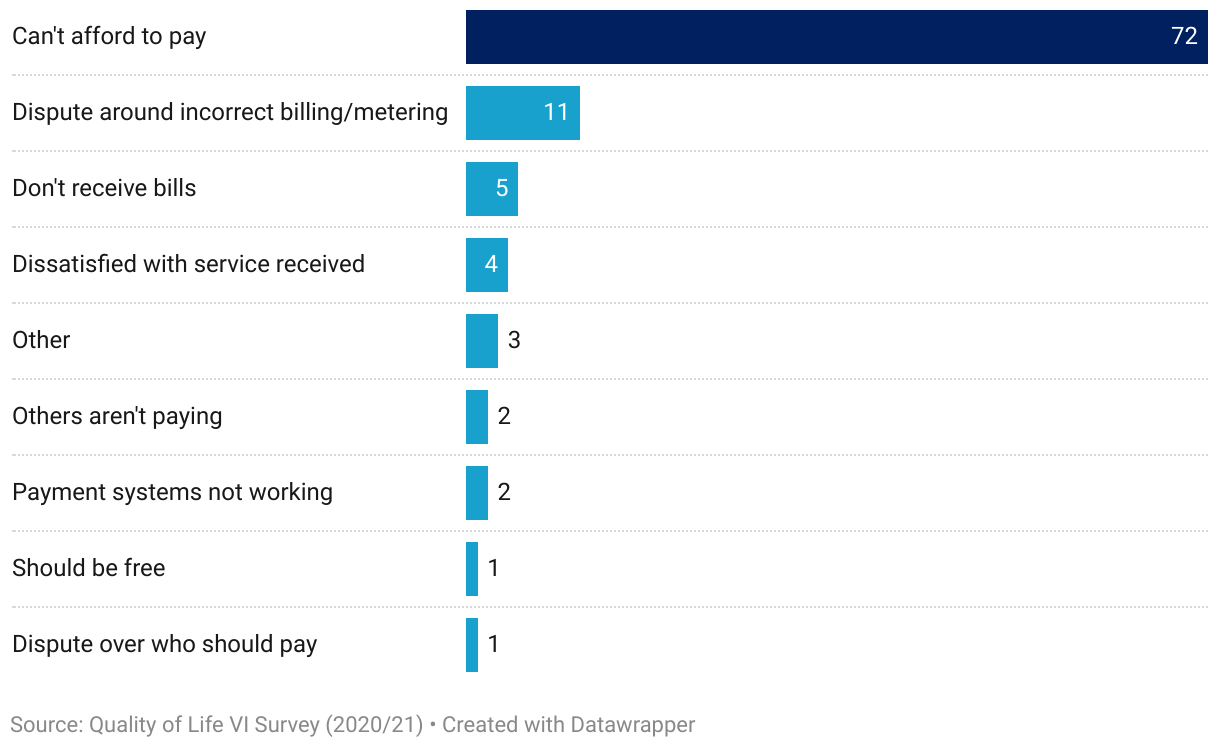
Figure 3: Reasons for unpaid municipal accounts
Billing has been a problem for some municipalities. There have been reports of residents protesting against huge bills which they claimed resulted from faulty metering or inaccurate meter readings (Naidoo, 2024). Our analysis shows that 11% of households were in arrears because they were disputing the bills they had received. Five percent were from households that were not receiving bills while four percent indicated that their households were not paying due to dissatisfaction with services. Despite these other reasons, it is clear that most of the unpaid accounts are due to households’ inability to pay. Failure of households to pay their bills based on affordability has several implications. Firstly, a household risks being disconnected from the mains disrupting home life for the household affected. This may also compel households to seek informal connections to electricity mains which is a public health risk. Secondly, if more households cannot pay for services, the service providers suffer revenue loss which impacts their ability to maintain service infrastructure.
Conclusion
Municipalities and their associated service entities in South Africa are caught up in a vicious circle in which non-payment of services by some users negatively impacts their financial performance and in turn weakens their ability to provide services (Glasser and Wright, 2020; Murwirapachena et al., 2023). Our analysis in this Map of the Month publication suggests that the main reason for unpaid accounts by households across the Gauteng province is affordability. The results from our analysis do not support the sometimes articulated notion that non-payment is due to consumer resistance to pay rooted in the rent boycotts of the apartheid days (van Schalkwyk, 2012; Murwirapachena et al., 2023). The recent Bill on Credit Control in municipalities is a step in the right direction in its proposal to introduce payment arrangements for service users to pay their arrears in installments.
References
Booysen, F LE. R. (2001), Non-payment of services: A problem of ability to pay. The South African Journal of Economics. Vol. 69:4.
Chaskalson, M., K. Jochelson and J. Seekings (1987). Rent Boycotts, the State, and the Transformation of the Urban Political Economy in South Africa. Review of African Political Economy, No. 40, Southern Africa: The Crisis Continues, pp. 47-64.
Fjeldstad, O.H., 2004. What's trust got to do with it? Non-payment of service charges in local authorities in South Africa. The Journal of Modern African Studies, 42(4), pp.539-562.
Glasser, M.D. and J. Wright (2020). South African municipalities in financial distress: what can be done? Law, Democracy, and Development. Vol. 24, pp. 413-441.
Murwirapachena G. M. M. Kabange and C. I. Ifeacho, (2023). "Non-payment culture and the financial performance of urban electricity utilities in South Africa," Development Southern Africa, Vol. 40(3), pp.615-631.
Naidoo, P. (2024). Municipalities- billing woes. https://www.leader.co.za/article.aspx?s=208&a=2557&title=Operations
van Schalkwyk, A, (2012). A case study of non-payment for municipal services in the Vhembe District Municipality. Mediterranean Journal of Social Sciences 3(12), 90–90.
Worku, Z. (2017). Factors That Affect The Nonpayment Of Municipal Services In Madibeng, Mamelodi, And Soshanguve Townships Of South Africa. Journal of Applied Business Research (JABR), 34(1), 99–116. https://doi.org/10.19030/jabr.v34i1.10097
Comments and Input: Richard Ballard and Graeme Götz
Map design: Jennifer Murray
Suggested citation: Mushongera, D., Ndagurwa, P. and Modiba, M. (2024). Unpaid accounts in the Gauteng City-Region: spatial patterns and underlying causes. Map of the Month. Gauteng City-Region Observatory. June 2024. https://doi.org/10.36634/VXOW8582.