De-densifying Gauteng: A thought experiment
-
- Date of publication: 29 May 2020
- Download map


As we come to grips with the effects of the COVID-19 pandemic, various urban forms and functions are being examined critically by urban scholars and policy makers. One dimension of the urban form that is being fiercely debated is population density. Government officials and scholars across the world, including South Africa, are re-examining the benefits and drawbacks of dense urban settlements in the context of COVID-19, and particularly how cities will be shaped after the pandemic. In the April 2020 Map of the Month, we showed how half of Gauteng’s population live on about 2 % of the land in the province. This month we provide another representation of population density – this time in 3D – and we use this representation to delve deeper into an analysis of population density in the context of the COVID-19 pandemic. This 3D density representation also serves as an update of the August 2013 Map of the Month which is based on 2011 census data.
The April 2020 Map of the Month’s representation of population density highlighted the uneven “horizontal” distribution of residents in Gauteng. Map 1, below, highlights the uneven “vertical” distribution of residents in Gauteng. The map draws on modelled population estimates, which the GCRO sourced from GeoTerraImage, and is represented here as the population per square kilometre in Gauteng.1 The densest square kilometre (the highest peak in Map 1) is clearly in Hillbrow (with more than 48 000 people), followed by the peaks in Diepsloot (between 24 000 and 48 000 people) and then peaks in various parts of townships around Gauteng (for example Soweto, Tembisa and Mamelodi).

Map 1: Gauteng's population density in 3D - tilted and rotated
Urban density, particularly around key economic centres and transport links, is generally considered desirable because of a range of associated benefits (see the April 2020 Map of the Month), including economies of scale, infrastructure efficiencies, and greater accessibility of people to job opportunities and urban amenities. The concentration of people in urban areas is one of the key reasons why cities thrive as centres of innovation.
However, high population density can also be associated with a range of negative consequences. In particular, the COVID-19 pandemic has raised concerns that dense urban areas (including townships and informal settlements) increase the risk of transmission. Comparisons have been made between well-performing low-density cities and high infection rates in very dense cities and some people are convinced that low density is “safer”. In line with this, some propose de-densifying parts of cities with the hope of reducing the transmission of COVID-19. The Department of Human Settlement, Water and Sanitation in South Africa has proposed de-densification as a potential way to combat COVID-19 in informal settlements, where preventative hygiene and social distancing are particularly challenging to implement.
There is little agreement on whether de-densification is a good idea in principle, given the many ways in which urban life benefits from higher population densities and that density in itself does not spread the COVID-19 virus. Even if there was sufficient agreement on whether de-densification, in principle, is an appropriate strategy to combat COVID-19, the task of measurably de-densifying places would require the relocation of very large numbers of people. In practice, ‘lowering the peaks of density’ in Map 1 would be an enormous, if not impossible, undertaking. In addition to Map 1, we have developed an interactive visualisation (below) to give some sense of the size of the de-densification task in Gauteng, if it was to be pursued.
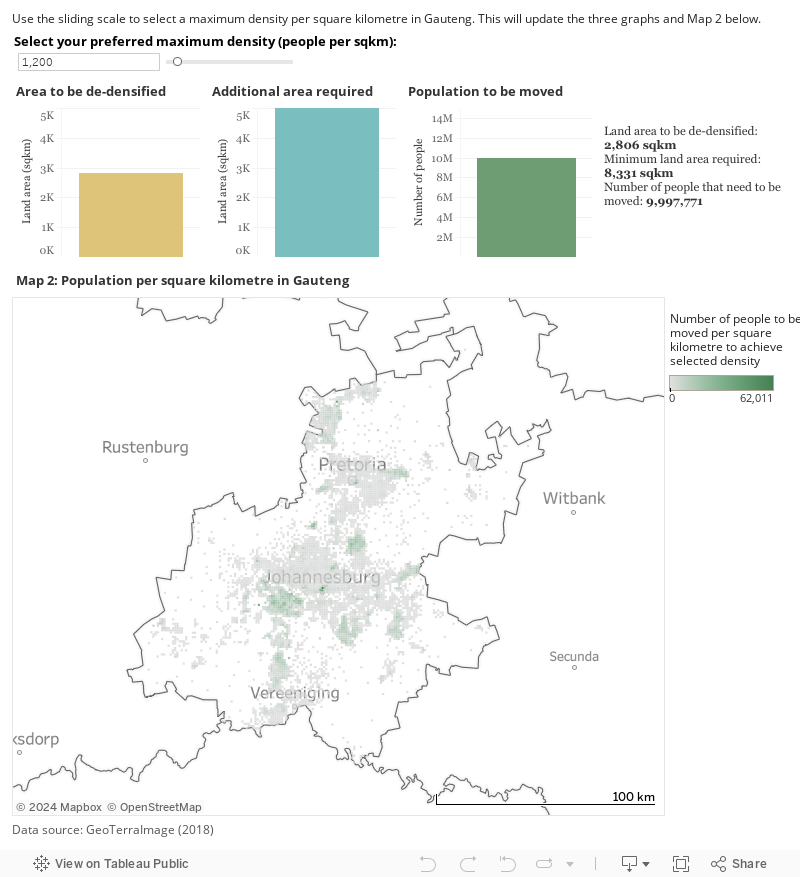
This interactive visualisation represents a thought experiment to help understand the relationship between density, population size and land area. This interactive visualisation considers what it would take to bring population density down to a particular threshold, in terms of the number of people who would need to be moved from densely populated areas and the minimum land area that would be required for their relocation.
The visualisation allows you to use a sliding scale to set hypothetical caps on density (number of people per square kilometre). It then calculates what it would take to achieve this maximum density across Gauteng, and presents these results in three graphs and a map. The graphs show the following:
- The total land area (km2) in Gauteng where current population density exceeds the selected threshold;
- The total number of people who would need to be moved out of the areas that are denser than the selected threshold; and
- The total land area required to accommodate those people who would need to be relocated, while maintaining the selected density threshold.
An ideal density guideline is always circumstantial and it needs to be considered along with household crowding, access to basic services and amenities, and the lived experience of density. Therefore it is very hard to include a density guideline here, but we can illustrate the size of the task. Map 2 (in the visualisation) is divided into 1 km2 blocks and shows the number of people in each square kilometre block who would need to be moved to achieve the selected density. The darker the green colour of a block the more people would need to be moved out of this area to achieve the selected maximum density. Importantly, Map 1 and 2 also provide a sense of the spatial scale of the de-densification task. The areas with high densities are spread across the province because most municipalities in the city-region have polycentric urban forms. The maps also show that any unoccupied or low-density land that could be used for resettlement is not located close to economic and transport nodes.
A de-densification strategy outlined by the national Human Settlement, Water and Sanitation department indicates that just over 14 000 units have been made available in Gauteng for people living in very dense informal settlements. This would accommodate approximately 42 000 people, assuming an average household size of 3 people.2 The proposed units have been allocated to various settlements in Gauteng. The 1 402 units that have been allocated to Zandspruit would reduce the population density of the settlement by about 20 % (Figure 1, below) and the 4 734 units allocated to Alexandra would only be able to reduce the density of Alexandra by about 11 % (Figure 2, below). This means that these settlements in effect remain very dense. The many other settlements in the province (like Soweto, Daveyton, and Tembisa) where new units have not been allocated also remain densely populated and at risk.

Figure 1: The population density of Zandspruit, Johannesburg.

Figure 2: The population density of Alexandra, Johannesburg.
While this de-densification strategy provides accommodation for some of the people currently living in dense and informal locations, the visualisation presented above highlights the inadequacy of such an approach in measurably lowering peak population density. The proposed strategy can only accommodate a small proportion of the population and would still leave many residents in ‘unfavourably’ high density settlements where testing, tracing and preventative care remain the only solutions to combat COVID-19.
Although a decisive early lockdown seems to have slowed the spread of the disease, and has moderated demand on health services, the interventions we implement next will have long term consequences for urban spaces and their ability to meet the needs of their inhabitants.
Deliberate planning for densification provides significant opportunities and benefits for cities, which are likely to be important in the post-COVID-19 development era. While the COVID-19 pandemic will have a long lasting impact on the way cities are developed, the value of transit oriented development is likely to endure, albeit with greater emphasis on public health.
While some policy positions name density as a problem to be addressed, vilifying dense areas in the context of the pandemic suspends the possibility of a more holistic recognition of the important role of density in cities. Furthermore, we encourage some deeper engagement with the long term implications of de-densification.
Whole books and journal articles have been written on the benefits and drawbacks of densification and de-densification, and there have been numerous articles on de-densification in South Africa over the past couple of months, so we do not attempt to resolve these debates here. Rather, we conclude with some thoughts and questions that hopefully will stimulate further analysis and constructive debate:
- Settlement density is only part of the concern with respect to COVID-19, the internal population density (area per person within a dwelling) and overcrowding are critical considerations. High population density and household crowding are not only problems in informal settlements, but in some parts of the city-region, formal housing poses similar density-related risks.
- Often, when spaces within informal settlements have been vacated, they are simply re-occupied by others, because of the demand for well-located residences.
- De-densification will be an expensive task especially with the long term infrastructure implications, and these finances could potentially be better spent elsewhere, on more direct and effective strategies to fight the virus or on upgrading informal settlements. The state was fiscally stressed before the onset of the COVID-19 pandemic and is now under enormous pressure to provide social support for those who have lost their incomes while also to cover the costs of testing, tracing, treatment and preventative care - all at large scales.
- De-densification will create new human settlements, resulting in settlement change, and requiring maintenance and management, all of which require careful consideration. GCRO’s February 2018 Map of the Month highlighted that formal housing developments (e.g. government provided housing) are often precursors to densification through the construction of backyard dwellings. These dwellings offer additional accommodation with typically better access to services than informal settlements, and they provide opportunities for rental income for homeowners.
- Despite the fact that many cities are concurrently becoming more dense and sprawling, urban development strategies in Gauteng (and South Africa) are deliberately focused on increasing density around economic hubs and transport nodes and links. De-densification is not currently part of these strategies, and although plans should be adaptable in the face of changing conditions, in the long term, de-densification will likely perpetuate urban sprawl, undermine economic productivity, reduce urban efficiency and walkability, and exacerbate inequality.
- Re-settlement locations must be clearly and transparently identified to ensure that these spaces are appropriate for human settlement, and that they take account of the long term implications for infrastructure and maintenance. In some cases, the areas identified for relocation might be intended as temporary settlements, but past experience of resettlement barracks shows that temporary settlements can become permanent.
- The process of relocating people cannot be done without breaking the norm of social distancing. As goods and people are loaded onto transport they will be brought into close contact with one another and therefore may give the virus greater chance to spread.
- Residents who are relocated often end up in worse socio-economic circumstances because they are moved further away from employment opportunities and social support facilities, and their social networks are severely disrupted. Even under good circumstances and even if one is moving to a better settlement, moving home remains one of the most stressful activities that people endure and therefore constitutes a ‘shock’ from which people must recover. Recovery is relatively easy under normal conditions of employment and public health, but our current circumstances (with respect to COVID-19) might compound existing shocks from which people are less likely to ‘bounce back’. This potential is exacerbated by how long it takes to establish the range of necessary social services, facilities and community support networks.
--
Footnotes
1 The modelled population estimates were provided per Enumerator Area (EA) in Gauteng. For the purpose of this visualisation, we aggregated EA data to a square kilometre grid by using the centroid of each EA. The result of using population estimates (which sometimes contain anomalies) and the spatial aggregation method, revealed two clear outliers. In these two cases the estimated population was much higher than evidence on satellite imagery would suggest. Accordingly for the 3D visualisation, we edited these values to more likely totals. Although the dataset contains some anomalies, it is the best dataset we have available at the necessary level of detail.
2 This assumption is based on GCRO’s QoL V (2017/18) survey, which shows that Gauteng has an average of 3.3 people per household and informal settlements have an average of 2.9 people per household.
--
Editors: Richard Ballard, Graeme Götz, Julia de Kadt, Alexandra Parker
Thanks to Ivan Turok for comments on the April 2020 map that fed into this map.
Recommended citation: Culwick Fatti, C., Hamann, C. and Naidoo, Y. (2020) ‘De-densifying Gauteng: A thought experiment’, GCRO Map of the Month, Gauteng City-Region Observatory, May 2020.