The Quality of Life Index 2020/21
How do the residents of Gauteng experience their lives? Whether or not we feel we are living a ‘good’ life is shaped by many different factors. The GCRO’s Quality of Life Index provides a tool to understand quality of life, as experienced by the residents of Gauteng, in a broad and holistic sense. Many measures of well-being and progress are reliant primarily on indicators reflecting material conditions of life, and can often only speak to well-being or progress at the provincial or even national level. The GCRO’s Quality of Life Index is able to take a different approach, by drawing on the rich, large scale, and individual level data generated by the GCRO’s Quality of Life Surveys. Calculated at an individual level, the GCRO Quality of Life Index is multidimensional, combining variables reflecting material living conditions along with variables reflecting the perceptions and experiences of the individual respondent.
The GCRO Quality of Life Index draws on 33 different variables, grouped into seven dimensions. Scores out of 100 are calculated for each of these seven dimensions, providing insight into different aspects of life in Gauteng. The seven dimension scores are then combined, providing a single, composite score, out of 100, measuring overall quality of life. Further details regarding the development of the Index are available here.
The seven dimensions that feed into the overall Quality of Life Index are Services, Socio-economic status, Government satisfaction, Life satisfaction, Health, Safety and Participation. Each dimension consists of between three and six individual variables. The chart below shows the seven dimensions, by clicking on a particular dimension, you can see the variables the dimension comprises.
Quality of Life Index across Gauteng
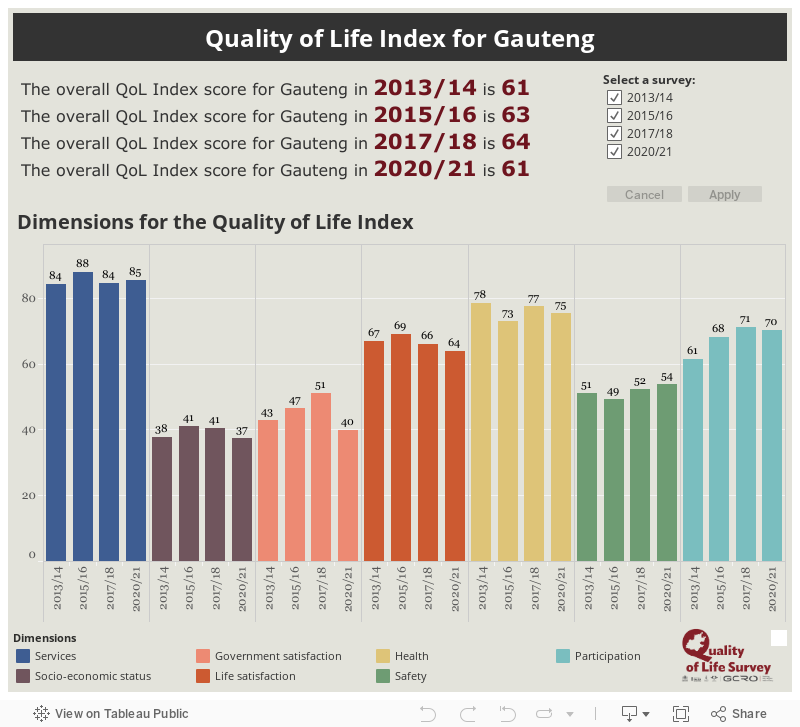
The visualisation below shows both dimension and overall Quality of Life Index scores for each iteration of the Quality of Life Survey since 2013/14. The overall Quality of Life Index score has risen gradually over time, reaching 64 in 2017/18. In 2020/21, however, it has fallen back to 61 - the same as in 2013/14. While this drop may seem relatively small in absolute terms, scores in composite indices of this nature typically change very little. Therefore, a drop of three full points over two years is noteworthy. Scores for two dimensions, Services and Safety, have seen marginal increases relative to 2017/18. All other dimension scores have fallen. Government satisfaction shows a particularly marked decline, from 51 in 2017/18 to 40 in 2020/21. Socio-economic status has fallen by four points relative to 2017/18. The declines for Health, Life satisfaction, and Participation are smaller.
Quality of Life index across Gauteng’s municipalities
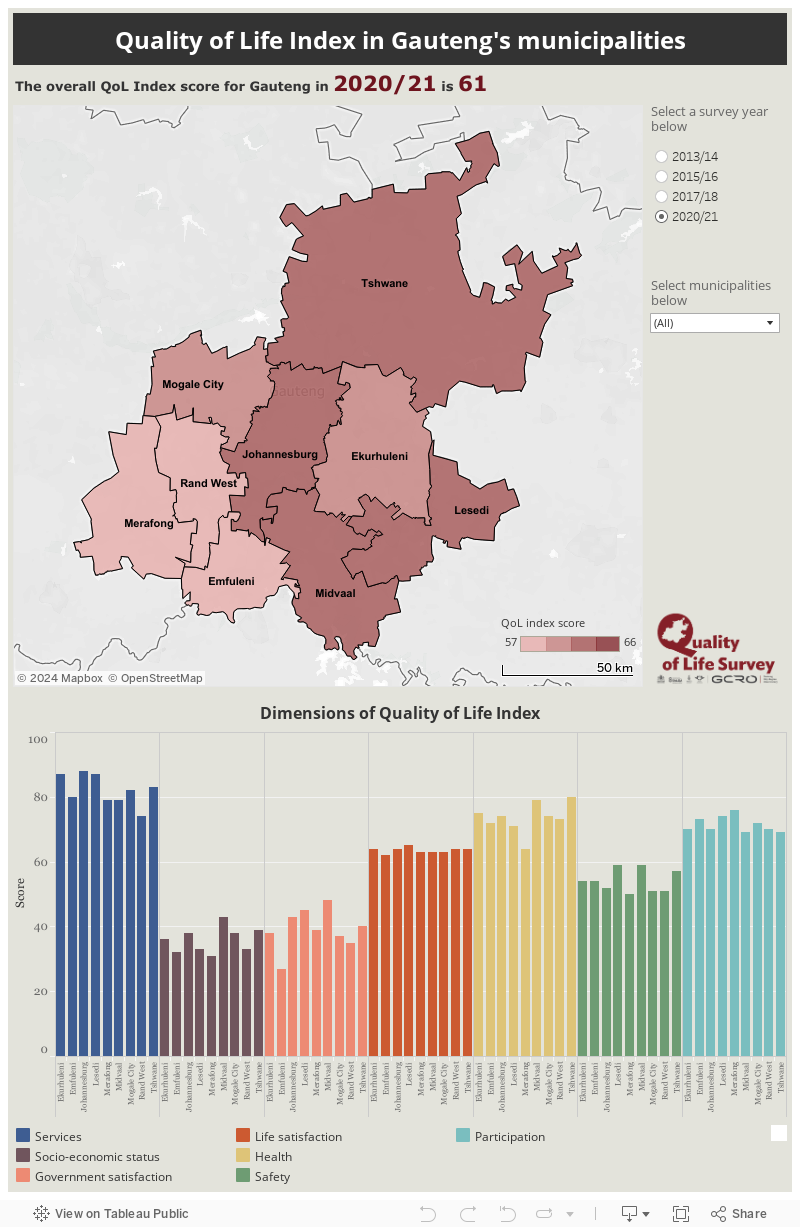
Within Gauteng, we see substantial variation in Quality of Life Index scores at the municipal level. While every municipality has experienced a decrease in its Quality of Life Index score relative to 2017/18, there are notable differences in the extent of the decrease. Midvaal has the highest Quality of Life Index score, at 63, but this is a three-point decrease from a score of 66 in 2017/18. Lesedi also scored 66 in 2017/18 but fell four points to 62 in 2020/21. The municipalities with the lowest scores in 2020/21 are Emfuleni, Merafong and Rand West, each dropping four or five points to a score of 57. The City of Tshwane has been the most consistent over time and has seen the smallest change, only dropping from 63 to 62. Both the City Johannesburg and the City of Ekurhuleni have seen their scores fall by three points, to 61 and 62 respectively.
Dimension scores at the municipal level also yield useful insights. In 2020/21, scores for the Services dimension range from 88 in the City of Johannesburg to 74 in Rand West. Socio-economic status scores range from 43 in Midvaal to just 31 in Merafong. Scores in the Government satisfaction dimension are the most variable, ranging from 48 in Midvaal to just 27 in Emfuleni. Scores in Life satisfaction are fairly consistent across municipalities, with the highest score of 65 in Lesedi, and the lowest at 62 in Emfuleni. In the Health dimension, Merafong stands out with a particularly low score of 64. By contrast, Midvaal has a score of 79, and the City of Tshwane has a score of 80. Safety scores are highest in Lesedi and Midvaal, at 59, while Merafong performs worst in this dimension, with a score of 50. By contrast, however, Merafong has the highest score, 76, in the Participation dimension, while Midvaal and the City Tshwane score lowest at 69.
Inputs and edits: Julia de Kadt, Alexandra Parker, Christian Hamann